SLS - Static Light Scattering.
SLS measures the time-averaged intensity of light scattered by particles in solution.
When to use SLS.
Unlike DLS, which analyzes fluctuations in scattered light over time, SLS measures the total amount of light scattered. This provides information about molecular weight, protein-protein interactions, and overall sample quality.
SLS is particularly valuable for therapeutic protein development, where high-concentration formulations are often required. A2 measurements can predict whether a candidate will remain stable and low-viscosity at clinically relevant concentrations.
SLS is ideal when you need to:
When to use SLS.
Unlike DLS, which analyzes fluctuations in scattered light over time, SLS measures the total amount of light scattered. This provides information about molecular weight, protein-protein interactions, and overall sample quality.
SLS is ideal when you need to:
• Determine oligomeric state – or confirm molecular weight
• Predict formulation behavior – at high concentrations via A2
• Pre-screen samples – before DLS to ensure adequate scattering
• Detect aggregation – or complex formation
• Assess protein-protein interactions – in different buffer conditions
SLS is particularly valuable for therapeutic protein development, where high-concentration formulations are often required. A2 measurements can predict whether a candidate will remain stable and low-viscosity at clinically relevant concentrations.
- Candidate library development
- Expression & Purification
- Developability Screening
- Formulation optimization
- Pre-clinical characterization
The science behind SLS.
Scattering intensity depends on molecular weight
When light passes through a solution containing macromolecules, some light is scattered at angles away from the incident beam. The intensity of scattered light depends on the size and concentration of the scattering particles.
Larger molecules scatter more light than smaller molecules. By measuring the scattered light intensity at a fixed angle and knowing the sample concentration, you can calculate the weight-average molecular weight (MW) of the particles in solution.
The Debye equation relates scattering to molecular properties
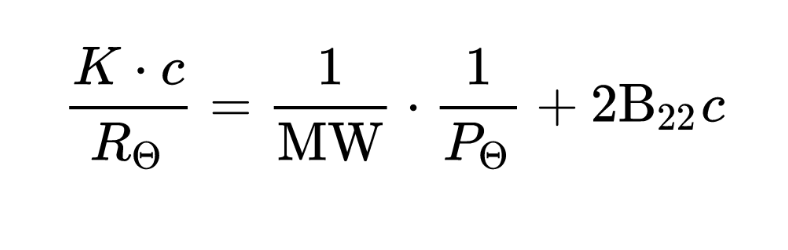
SLS measurements are typically performed at multiple concentrations. The relationship between scattering and concentration is described by the Debye equation:

Where:
– K is an optical constant (depends on wavelength and refractive index)
– c is the concentration
– Rθ is the Rayleigh ratio (proportional to scattered intensity)
– MW is the weight-average molecular weight
– A2 is the second virial coefficient
Plotting Kc/Rθ versus concentration produces a linear relationship. The y-intercept gives 1/ MW, and the slope gives 2*A2.
The second virial coefficient reveals protein-protein interactions
- Positive B22: Proteins repel each other (favorable for high-concentration formulations)
- Negative B22: Proteins attract each other (risk of aggregation or high viscosity)
- B22 near zero: Proteins behave nearly ideally (minimal interactions)
Negative B22 values are a red flag for therapeutic development because they predict problems at high concentrations: aggregation, precipitation, or unacceptably high viscosity.
Parameters you measure with SLS.
Molecular weight (MW)
The weight-average molecular weight of particles in solution. This confirms the oligomeric state (monomer, dimer, tetramer, etc.) or detects aggregation. For example, if you expect a 150 kDa monomer but measure 300 kDa, your protein is forming dimers.
Second virial coefficient (A22 or B22)
A measure of protein-protein interactions. Positive values indicate repulsive interactions (good for formulation). Negative values indicate attractive interactions (risk of aggregation).
Initial scattering intensity
Better show than tell. See how DLS generates information about your sample.
How SLS complements other techniques.
SLS provides information about molecular weight and protein-protein interactions that DLS doesn’t directly measure. While DLS tells you the size distribution and heterogeneity of your sample, SLS tells you the average molecular weight and whether proteins will interact favorably or unfavorably at higher concentrations.
Combining SLS with DLS gives you a comprehensive view of colloidal stability. Add nanoDSF for conformational stability, and you have a complete stability profile.
“NanoTemper helps us turn challenging biophysical tasks into routine workflows. Their intuitive solutions give us reliable data faster, so our teams can focus on advancing drug candidates.”
Our biophysical tools
that use SLS.
Join the Newsletter
Get email updates. Your edge in biophysics. Subscribe today.
Our latest research in Static Light Scattering.
Frequently Asked Questions
Lorem ipsum dolor sit amet, consectetur adipiscing elit. Integer tellus tellus, ornare a felis quis, semper tempus elit. Donec in facilisis magna.